Will global warming reach +1.5°C by 2030, and why?
Compare versions Back to question
-
Study the background information carefully.
-
Read the background information carefully, before proceeding.
Changes from version 1 to 2
Undo changes
Your challenge
Predict the temperature anomly (in °C) of theYour challenge
for 2030. The annual Global Climate Report 2017 [1]
Predict the temperature anomly (in °C) of the annual Global Climate Report for 2030.
The global climate
The IPCC 5th Assessment Report [2] linked warming of the atmosphere and oceans to the emission of greenhouse gasses, stating that "it "It is extremely likelythat human influence is the dominant cause of observed warming since 1950". The report also forecasts some impacts of further emissions, such as an increase in acidification of the ocean.
(Wikipedia: IPCC Fifth Assessment Report Link: https://en.wikipedia.org/wiki/IPCC_Fifth_Assessment_Report )The international Paris Agreement signatory countries declared an intent to mitigate the effects of global warming
(by lowering emissions). The US since has declared an intent to withdraw from the agreement. (Wikipedia: Paris Agreement Link: https://en.wikipedia.org/wiki/Paris_Agreement )Recently, a Special IPCC Reportpredicts
NOTES:
- These possible impacts could be part of a series of further prediction questions on Prediki, if there is audience interest.
- The degree of desirability or undesirability of these predicted impacts may differ for different persons depending on individual circumstances.
The past years
The charts below show the global mean temperature anomaly for land and ocean temperatures since the start of the industrial revolution (left) and the last few years (right).
| 1880 - 2017 | 2012 - 2017 | |
|---|---|---|
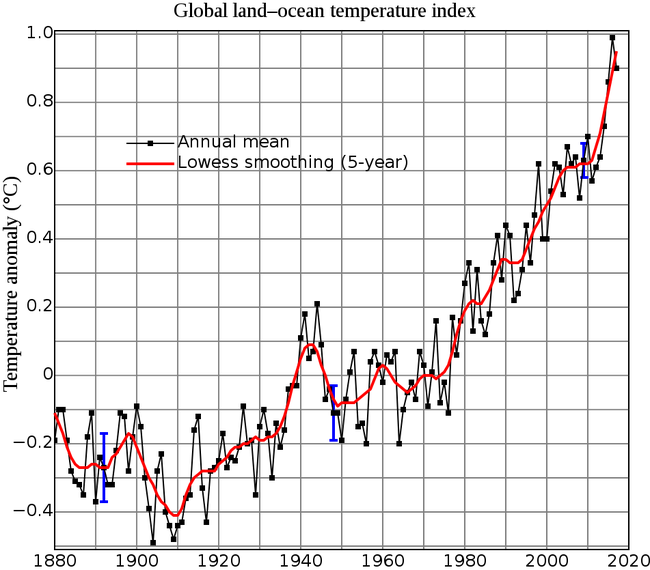 Link: /mediadb/image/e5bc53d4d5354b94ac022bfdc8315fc0/ Link: /mediadb/image/e5bc53d4d5354b94ac022bfdc8315fc0/ |

Sources: Berkeley Earth - Land and Ocean Summary (left), NOAA's annual Global Climate Report (right).
Sources
- NOAA's Global Climate Reportfor 2017.
Wikipedia article on the IPCC Fifth Assessment Report Link: https://en.wikipedia.org/wiki/IPCC_Fifth_Assessment_Report .Wikipedia article on the Paris Agreement Link: https://en.wikipedia.org/wiki/Paris_Agreement .Wikipedia article on the Special Report on Global Warming Link: https://en.wikipedia.org/wiki/Special_Report_on_Global_Warming_of_1.5_%C2%B0C .